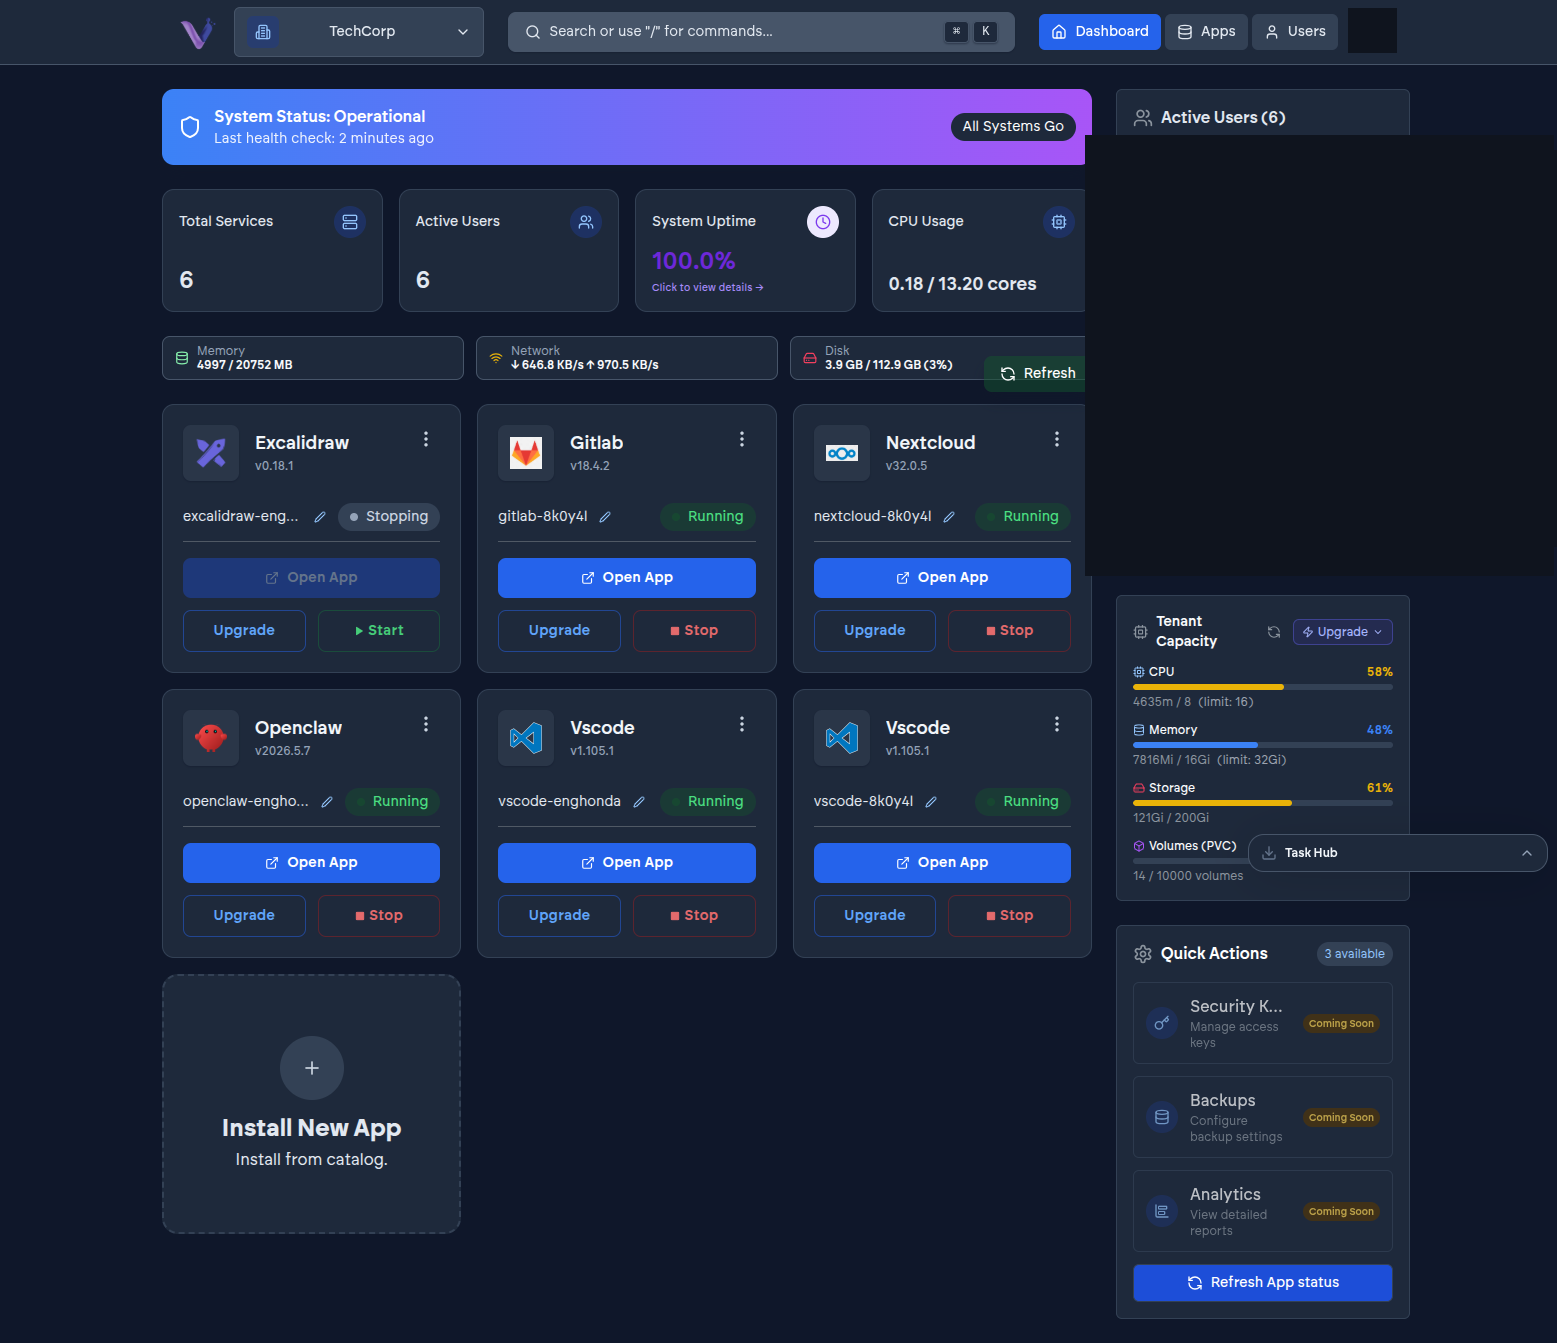
Organization-wide usage#
The dashboard's quota view shows your organization's compute allowance against what's currently in use across every installed instance. Check this before installing something resource-intensive, or when something feels slower than expected - it's the first place to look.
Per-instance metrics#
Each instance's own page breaks down its resource use individually: processor and memory, network traffic in and out, and disk usage. This is where you'd go to figure out which specific instance is consuming most of your organization's shared quota, rather than just knowing the total.
Uptime#
Alongside resource metrics, each instance has its own uptime view, and there's an organization-wide rollup too - useful for confirming an app has actually been reliably reachable rather than just checking whether it's up right now. See Uptime.